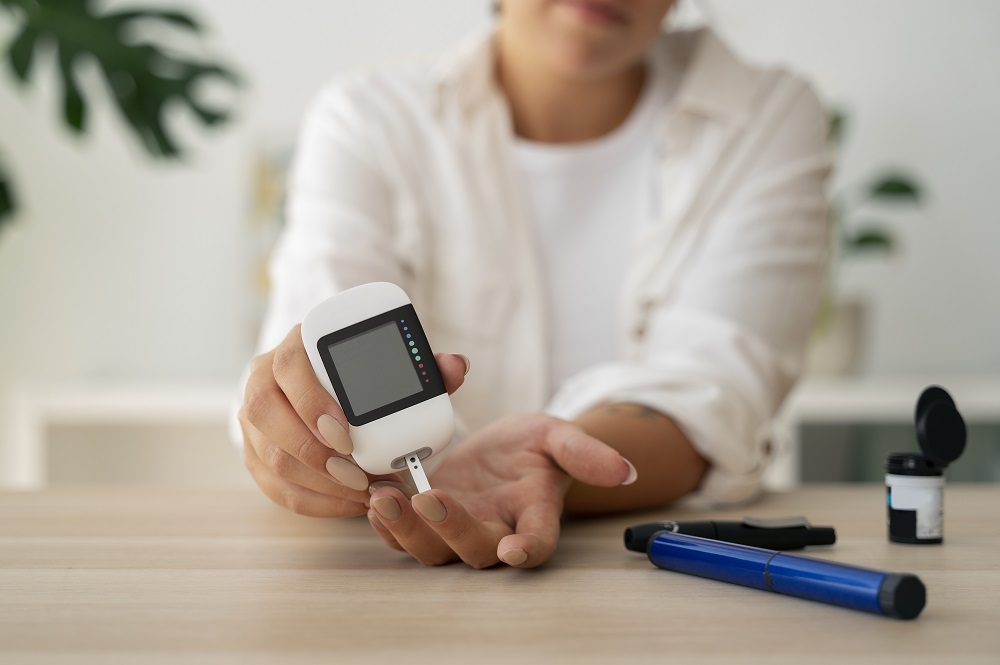
You’ve just left the doctor’s office. There’s a printout in your hand, or maybe a notification in your patient portal, with a column of numbers, flagged values, and reference ranges that don’t mean much on their own. Your A1C is 6.8%. Your LDL is 112. Your fasting glucose was 124.
What does any of it mean? What’s a problem and what isn’t?Blood panels for diabetes and heart health include some of the most important numbers in preventive medicine. Understanding them requires a clear explanation, which is exactly what this guide provides.
This guide is built for exactly that moment. It covers the key lab tests your primary care doctor runs to monitor diabetes and cardiovascular risk, what each number measures, and what the results mean for your health.
Why These Tests Are Ordered Together
When a primary care doctor orders labs for a patient managing diabetes or cardiovascular risk, the results aren’t reviewed individually. They’re read as a picture; how these markers interact tells a more complete story than any single number alone.
A patient with an A1C of 7.2%, blood pressure trending upward, and an LDL of 118 has a very different risk profile than someone with the same A1C but normal blood pressure and LDL below 70. The numbers provide context for each other.
The A1C Test: Your 3-Month Blood Sugar Average
What It Measures
The A1C test, short for hemoglobin A1C, or glycated hemoglobin, reflects your average blood sugar level over the past two to three months. It works by measuring the percentage of your hemoglobin (the protein in red blood cells that carries oxygen) that has sugar molecules attached. The higher your blood sugar has been, the more hemoglobin gets “glycated”, so the A1C percentage rises.
Unlike a fasting glucose test, which captures a single moment, A1C captures the trend. That’s what makes it so clinically useful; it’s harder to artificially improve before a blood draw.
What the Numbers Mean
| A1C Result | What It Indicates | What Typically Happens Next |
| Below 5.7% | Normal blood sugar regulation | Rescreen every year (sooner with risk factors) |
| 5.7%-6.4% | Prediabetes | Lifestyle counseling; retest in 3-6 months |
| 6.5% or higher (confirmed) | Type 2 diabetes | Treatment plan initiated; A1C rechecked every 3 months |
| Below 7% (if already diabetic) | Well-controlled diabetes | A1C rechecked every 3 months; current plan maintained |
| 7%-9% (if already diabetic) | Needs improvement | Medication review, lifestyle adjustment, and more frequent follow-up |
| Above 9% (if already diabetic) | Significantly elevated | Treatment intensification; closer monitoring |
When A1C Can Be Misleading
A1C doesn’t work the same way for everyone. It can read falsely low or falsely high in people with certain blood conditions, including sickle cell trait, hemolytic anemia, or iron deficiency anemia. In these cases, doctors use alternative testing methods, including fasting plasma glucose or a continuous glucose monitor (CGM), to get a more accurate picture.
Pregnancy is another situation where A1C is less reliable as a standalone tool, which is why gestational diabetes monitoring uses different approaches.
What Lowers A1C
In general, reducing refined carbohydrates, increasing physical activity, losing weight, taking medications consistently, and reducing overall calorie intake if overweight all help lower A1C. Even a single percentage point drop, from 8% to 7%, for example, meaningfully reduces the risk of long-term diabetes complications.
Fasting Blood Glucose: The Snapshot Test
What It Measures
A fasting blood glucose test measures the concentration of sugar in your blood after you haven’t eaten for at least 8 hours (typically overnight). It captures where your blood sugar settles when it’s not influenced by a recent meal, reflecting how well your body regulates glucose at baseline.
Understanding the Numbers
| Fasting Glucose Result | What It Indicates |
| Below 100 mg/dL | Normal |
| 100-125 mg/dL | Prediabetes (impaired fasting glucose) |
| 126 mg/dL or higher (on two tests) | Diabetes |
| Below 70 mg/dL | Hypoglycemia (low blood sugar), needs prompt attention |
For people already diagnosed with diabetes, fasting glucose is one benchmark, but it tells less of the story than A1C for monitoring overall control. That said, some patients do home glucose monitoring with a finger-stick device (BGM) or a continuous glucose monitor (CGM), and fasting readings are part of how they track daily patterns.
Post-Meal Blood Sugar
Blood sugar peaks roughly 1-2 hours after eating. For most healthy adults, this peak stays below 140 mg/dL. In people with diabetes or prediabetes, post-meal glucose often runs higher than fasting glucose, sometimes significantly so, even when the fasting number looks acceptable.
This is one reason A1C can flag a problem that a fasting-glucose-only approach misses. If your meals are regularly spiking your blood sugar into the 200s but returning to normal by morning, your fasting glucose looks fine, but your A1C reflects all those daily peaks.
The Lipid Panel: Breaking Down Your Cholesterol Numbers
A standard lipid panel gives your doctor four numbers. Each one tells a different piece of the cardiovascular story.
LDL “Bad” Cholesterol
LDL (low-density lipoprotein) is the type of cholesterol that builds up in artery walls, forming plaques that narrow blood vessels and increase the risk of heart attack and stroke. It’s the number most doctors focus on when assessing cardiovascular risk.
| LDL Level | General Category | Context for Diabetes Patients |
| Below 100 mg/dL | Optimal | Standard target for most adults |
| 100-129 mg/dL | Near-optimal / Above optimal | May need treatment depending on overall risk |
| 130-159 mg/dL | Borderline high | Treatment usually indicated when diabetes present |
| 160-189 mg/dL | High | Medication is almost always recommended |
| 190 mg/dL or above | Very high | Statin therapy plus possible additional agents |
For people with diabetes and established cardiovascular disease, or those with multiple risk factors, the LDL target often drops to below 70 mg/dL, reflecting the higher baseline risk. Your doctor sets your specific target based on your full risk profile, not just the LDL number.
HDL “Good” Cholesterol
HDL (high-density lipoprotein) works in reverse; it carries cholesterol away from artery walls and back to the liver for processing. Higher HDL is protective. Low HDL is a risk factor, and it’s common in people with type 2 diabetes and metabolic syndrome.
- Men: HDL below 40 mg/dL is considered low and a cardiovascular risk factor
- Women: HDL below 50 mg/dL is considered low
- HDL above 60 mg/dL is considered protective
Exercise is one of the most effective ways to raise HDL. Smoking lowers it. Some medications, including certain fibrates, can modestly raise it, but the primary focus of treatment is usually on lowering LDL rather than directly targeting HDL.
Triglycerides
Triglycerides are a type of fat found in the blood. They’re elevated by eating excess calories, particularly from refined carbohydrates, sugary foods, and alcohol. High triglycerides are extremely common in people with type 2 diabetes and insulin resistance.
| Triglyceride Level | Category |
| Below 150 mg/dL | Normal |
| 150-199 mg/dL | Borderline high |
| 200-499 mg/dL | High |
| 500 mg/dL or above | Very high (risk of pancreatitis) |
Lowering triglycerides responds well to lifestyle changes, such as cutting back on refined carbs and sugar, reducing alcohol, exercising regularly, and losing weight. Improving blood sugar control also lowers triglycerides, which is why this number often improves alongside A1C when a person’s diabetes management gets better.
Total Cholesterol
Total cholesterol is all the cholesterol in your blood combined, LDL, HDL, and a fraction of triglycerides. A level below 200 mg/dL is considered desirable. But total cholesterol alone can be misleading: someone with a total of 210 mg/dL but high HDL and low LDL may be in better cardiovascular shape than someone with a total of 185 mg/dL but very low HDL and elevated LDL.
Kidney Function Tests: What They Reveal About Diabetes and Blood Pressure
What They Measure
Two key tests assess how well your kidneys are working: Creatinine and eGFR (estimated Glomerular Filtration Rate): Creatinine is a waste product your kidneys filter out; eGFR estimates how efficiently they’re doing it. A declining eGFR over time signals worsening kidney function.
Urine microalbumin (albumin-to-creatinine ratio): Detects small amounts of protein (albumin) leaking into the urine. This is the earliest sign of kidney damage from diabetes or high blood pressure, often detectable years before symptoms appear.
What the Numbers Mean:
| eGFR (mL/min/1.73m²) | Kidney Function Stage |
| 90 or above | Normal (if no other kidney disease signs) |
| 60-89 | Mildly reduced |
| 45-59 | Mildly to moderately reduced |
| 30-44 | Moderately to severely reduced |
| 15-29 | Severely reduced (specialist referral typically needed) |
| Below 15 | Kidney failure (dialysis or transplant evaluation) |
How to Read Your Lab Report Without Panicking
Lab reports are designed for medical records, not for patients reading them at home after dinner. Here’s how to make sense of a typical printout:
- “H” or “L” flags: These indicate a value is above or below the lab’s reference range. A flag doesn’t always mean something is medically significant, reference ranges are population averages, and context matters. Your doctor interprets flagged values in the context of your specific history.
- Reference ranges: The normal ranges listed on your report are statistical norms for a general population. For patients with diabetes or cardiovascular disease, the targets are often stricter than the reference range shown.
- Trending over time: A single result means less than a pattern. If your LDL has been 115, 118, and now 122 over three years, that upward trend matters more than whether 122 is technically in range.
- “Out of range” isn’t always urgent: A mildly elevated triglyceride result often means a dietary change is warranted, not an emergency. A very elevated creatinine in the context of known kidney disease is different from a first-time, mildly elevated result.
How Often Should These Tests Be Done?
| Test | Who Should Get It | How Often |
| A1C | All patients with diabetes or prediabetes | Every 3 months if not at goal; every 6 months if stable |
| Fasting Blood Glucose | Adults 45+, or any age with risk factors | Annually if normal, more frequently with prediabetes or diabetes |
| Lipid Panel (full) | Adults 20+; all diabetes patients | Annually, more often if indicated |
| eGFR (kidney function) | All diabetes and hypertension patients | Annually, more often if indicated |
| Urine Microalbumin | All diabetes patients | Annually |
| TSH (thyroid) | Adults with fatigue, weight changes, or thyroid risk factors | Annually and as needed |
What Happens When a Result Is Concerning?
If a lab result comes back flagged or outside your target, the next steps depend on how far out of range it is and how it compares to previous results.
A mildly elevated A1C in a patient who recently changed their eating habits might mean a closer follow-up in three months rather than an immediate medication change. An LDL of 160 in someone with diabetes and a family history of early heart disease might prompt a statin prescription at that same visit.
The conversation your doctor has with you about results isn’t just about the numbers; it’s about what’s driving them, what’s already been tried, and what the most practical next step is. That’s why having a consistent primary care relationship matters. A doctor who knows your history sees your lab results in context rather than in isolation.
Lab Work Through Hillside Primary Care
Hillside Primary Care performs routine lab work as part of annual wellness visits and chronic condition follow-ups across its Texas locations, including San Antonio, Killeen, Schertz, El Paso, Live Oak, Seguin, and New Braunfels.
- A1C + fasting glucose together establish a diabetes diagnosis and control
- LDL + blood pressure + diabetes status together determine cardiovascular risk
- Creatinine/eGFR + urine microalbumin together track kidney health over time
- Triglycerides + HDL + blood glucose together indicate metabolic syndrome risk
This is why primary care is the right place to manage these conditions, not because a specialist couldn’t read each number, but because only your primary care physician is reading all of them together, every visit, across months and years of your care.
At Hillside Primary Care, your lab results are reviewed in the context of your full health history, medications, lifestyle, and trends over time. If something is moving in the wrong direction, your provider catches it early and adjusts your plan before it becomes a crisis.
Can I get all these tests done at Hillside Primary Care in one visit?
Yes. Hillside Primary Care offers comprehensive in-house lab services, including A1C, fasting glucose, lipid panel, kidney function, urine microalbumin, and blood pressure monitoring, all in a single visit. For patients with diabetes or cardiovascular risk factors, these tests are typically bundled into your regular follow-up visit. Schedule your lab visit →
For patients whose cholesterol, blood sugar, or kidney function results warrant a closer look at their heart, Hillside’s in-house cardiac evaluation, including echocardiogram and EKG, is available without a separate specialist referral.
The same care team that reads your labs can also assess how those numbers have affected your heart over time.
To schedule labs or a follow-up visit, call (210) 742-6555 or book online at hillsideprimarycare.com/appointment/.
Same-day appointments are available at all locations.
FAQs
Q1. Can I lower my A1C in just a few weeks before a test?
Ans: Not significantly. A1C reflects the past 2-3 months. Short-term changes before a blood draw don’t move the number much, which is why it’s a more reliable measure than fasting glucose alone.
Q2. My total cholesterol is 205, but my doctor isn’t concerned. Why?
Ans: Total cholesterol without context can be misleading. If your HDL is high and LDL is at a good level, a total of 205 mg/dL may carry a low risk. The components matter more than the total.
Q3. What does it mean if my fasting glucose is normal but my A1C is in the prediabetes range?
Ans: It often means your post-meal blood sugar is running higher than your fasting baseline suggests. A1C captures that hidden elevation that fasting tests miss.
Q4. Why does my doctor check my kidneys when I have diabetes but no kidney symptoms?
Ans: Diabetic kidney disease causes no symptoms until it’s significantly advanced. Annual kidney screening catches early damage, when it’s still very treatable.
Q5. Should I fast before getting my cholesterol checked?
Ans: For a full lipid panel, including triglycerides, fasting for 9-12 hours gives the most accurate result. Your doctor’s office will tell you whether fasting is required for your specific test.
About the Author